Share this
Using a Gantt Chart for Project Management: Tips for Beginners
by Jarno Koopman on September 2, 2022

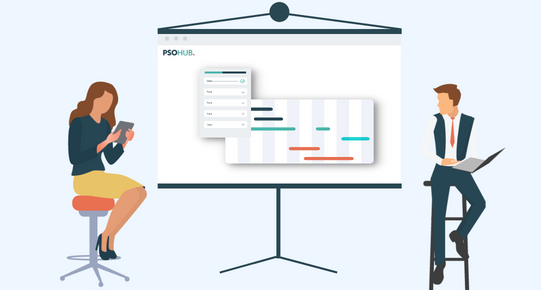
The Gantt chart still reigns as one of the most effective, powerful tools for project management, specifically in regards to project planning and tracking.
Even though the Gantt chart in its original form made its first appearance nearly a century ago, its simplicity and its power as a visual tool make it a great option for project management in the digital age. That’s why the bulk of adept project management software today will include a Gantt chart feature, that will update in real-time and be able to leverage more than just your task data.
With these ‘smart’ Gantt charts, you can plug into your project management like never before.
If you’re new to using Gantt charts for project management, check out our tips to help you do cool stuff, boost your team’s productivity, and more.
6 Beginner Tips for Project Management with a Gantt Chart
1. Don’t make one if you don’t need one
Although this is an article for people that probably need a Gantt chart to break down and organize a complex project, the point needs to be made: Not all projects really require one. Often, projects with less dependencies and less stakeholders can simply be managed with a task board or task list. Processes are also technically better served by a flow chart and don’t need a Gantt chart to plan and track. Even with awesome project management software in tow, a solid Gantt chart will take you more than an hour to create. For certain industries like design and construction, they’re a no-brainer. But for other businesses and small projects, using a Gantt chart isn’t always necessary.
2. Be clear on your task dependencies
One of the biggest strengths of the Gantt chart as a tool is that it can clearly show you, at just a glance, the interrelationships between all your tasks on the project timeline. Brainstorm and contemplate your project dependencies clearly before you start getting into a project chart. Creating a Gantt chart as an exercise in itself will help you get clear on how your tasks relate to one another; but being crystal clear on task relationships early on, during the project planning stage, will put you at a larger advantage. Does one task need to be completed before another begins? Can task A not end until task B can be completed? You get the drift. First, do your brainstorming and then your Gantt chart to get 100% clear on the way your project’s tasks are related to one another and to the timeline.
3. Give others access (read-only)
Our two cents? There should only be 1 admin, at the most 2, who can make major changes to the Gantt chart. That said, give your team read-only access to include them on project planning and the holistic status of the project. This can be an easy motivator for productivity as the project progresses. Also, you should be able to give your clients read-only access to your Gantt chart, while also selecting only the information you want them to see. For service businesses, this can go a long way with promoting transparency and building trust with clients. Especially for those clients who like to be involved at every step of the process, giving read-only access to your Gantt chart is highly recommended. 
4. Use your Gantt chart for project tracking
One of the biggest differences between the old-school Gantt chart and the new, smart ones provided by software is efficient project tracking. Back in the day, manual work (aka moving sticky notes or updating a spreadsheet) was necessary to update the status of your project. For agile and hybrid project management in particular, this could get cumbersome. Now, with project management software that connects tasks, time, and resources to your Gantt chart, you basically have automatic, built-in project tracking. Anyone who has access can easily see the real-time project status and furthermore, digest the info in the blink of an eye.
5. Use your Gantt chart for resource planning and to prevent burnout
Want to get better at resource planning? You can do it all from the Gantt chart. Want to prevent burnout? After plugging in your resource capacity information into your Gantt chart, make sure you select it for display. This way, you can easily see who on the team is perhaps getting maxed out and who could use some more work. With just a glance, all without having to leave the Gantt chart itself. Next, you can then easily make moves to reassign tasks, etc, all while staying in the Gantt chart and keeping your project management in one place. You’ll be alerted to burnout before it happens and able to make the necessary adjustments. A team morale boost for the win.
6. Review your chart at the beginning and end of each week
However your work week looks, set two alerts in your Google/Outlook calendar to review your Gantt chart: one for the very beginning of the work week and one on the last day. For one, you may need to account for progress and other changes that aren’t able to be automatically updated by your software. Someone might get sick, you might have to change start and end dates, etc. And secondly, because the Gantt chart’s power is in its visual prowess, reviewing at the week’s start will help imprint the project in the subconscious, as it will at the end of the week. This can help to keep your mind on the best outcomes for the project as a whole and may even foster creative solutions to problems throughout the project lifecycle.
Gantt charts made easy
Gantt charts rock for project management, and using them is easy with robust software. PSOhub’s Gantt chart feature is consistently praised by users around the world. Because PSOhub offers all-in-one project management, you can leverage even more data from your projects into your Gantt charts, if you choose. For example, you can easily connect self-driving time tracking to your Gantt chart. This means that your individual team members can track time automatically, while you can see it happening in real-time on the Gantt chart.
(Pssst… PSOhub is seriously affordable PSA software! Aka– it’s cheap and it automates everything that service businesses need.)
Share this
- Project Management (101)
- Productivity (63)
- Time Tracking (27)
- PSA Software (26)
- HubSpot (20)
- Resource Management (15)
- Invoicing (12)
- Salesforce (11)
- AI (10)
- Profitability (8)
- Contract Management (7)
- collaboration (5)
- Gantt Chart (4)
- Microsoft Dynamics (4)
- Budget Management (3)
- Consultancy (3)
- Financial services (3)
- Integrations (3)
- Quickbooks (3)
- Quote (3)
- ROI (3)
- Traffic Management (3)
- About PSOhub (2)
- Automation (2)
- Digital Marketing & Advertising (2)
- Pipedrive (2)
- Work Management (2)
- IT Companies (1)
- Product (1)
- Risk Management (1)
- Task Management (1)
- Ticket Sync (1)
- Workload Management (1)
- power bi (1)
- December 2025 (2)
- November 2025 (3)
- October 2025 (2)
- September 2025 (1)
- August 2025 (1)
- July 2025 (4)
- June 2025 (1)
- May 2025 (5)
- April 2025 (4)
- March 2025 (3)
- February 2025 (3)
- January 2025 (3)
- December 2024 (1)
- November 2024 (5)
- October 2024 (5)
- September 2024 (1)
- August 2024 (4)
- July 2024 (3)
- June 2024 (5)
- May 2024 (4)
- April 2024 (5)
- March 2024 (5)
- February 2024 (4)
- January 2024 (3)
- December 2023 (2)
- November 2023 (6)
- October 2023 (5)
- August 2023 (6)
- July 2023 (2)
- June 2023 (4)
- May 2023 (4)
- April 2023 (3)
- March 2023 (4)
- February 2023 (4)
- January 2023 (3)
- December 2022 (5)
- November 2022 (3)
- October 2022 (4)
- September 2022 (5)
- August 2022 (7)
- July 2022 (1)
- June 2022 (7)
- May 2022 (6)
- April 2022 (2)
- March 2022 (2)
- February 2022 (4)
- January 2022 (4)
- December 2021 (5)
- November 2021 (2)
- October 2021 (2)
- September 2021 (3)
- August 2021 (3)
- July 2021 (2)
- June 2021 (2)
- May 2021 (3)
- April 2021 (2)
- March 2021 (2)
- February 2021 (3)
- January 2021 (5)
- December 2020 (4)
- November 2020 (2)
- October 2020 (4)
- September 2020 (5)
- August 2020 (4)
- July 2020 (4)
- June 2020 (1)
- May 2020 (4)
- April 2020 (8)
- March 2020 (7)
- January 1970 (1)


